Angle-angle
Diagrams
Figure A – angles of the right ankle and knee
throughout the course of a normal gait cycle plotted as a time series – heel
strike (point 1) to the next heel strike (point 100) – each sample on the graph
represents a given angle for either the knee (red) or ankle (blue)
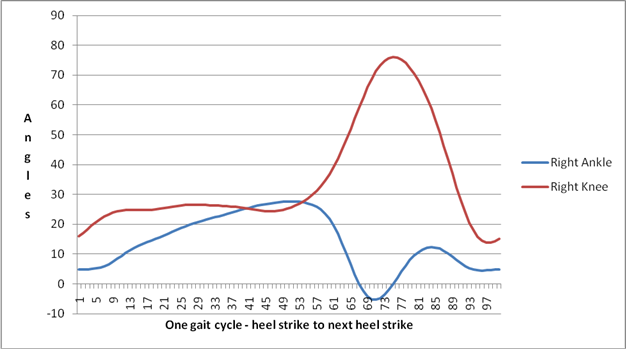
Figure B -
Angle-angle diagram – Walking on treadmill both legs moving at the same
speed – match up the point of peak knee flexion (about sample 74, 75 degrees)
with the corresponding ankle angle (0 degrees) and see if you can find that
point on the angle-angle diagram.

Figure C – angles of the right ankle and knee
throughout the course of a gait cycle plotted as a time series – heel strike
(point 1) to the next heel strike (point 100) – each sample on the graph represents
a given angle for either the knee (red) or ankle (blue) – the left leg is
moving at twice the speed of the right leg in this example

Figure D - Angle-angle diagram – Walking on
treadmill with the left leg moving twice as fast as the right leg– match up the
point of peak knee flexion (about sample 80, 69 degrees) with the corresponding
ankle angle (10 degrees) and see if you can find that point on the angle-angle
diagram
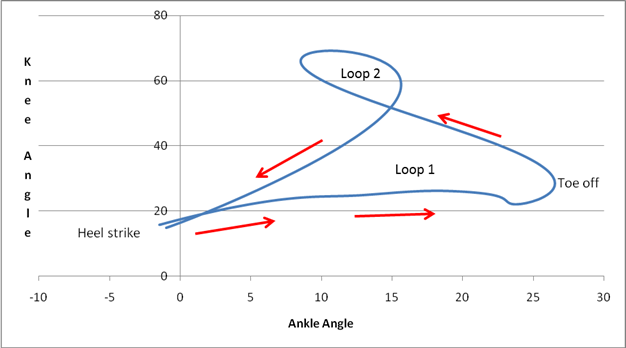
From this example the value of angle-angle diagrams should be clear. What differences do you immediately notice when you look at the two angle-angle diagrams? How would you describe the compression of the ‘Loop 2’? That is, is the more or less right ankle flexion during split belt locomotion, is their more or less right knee flexion? From the angle-angle diagram its very obvious that the relationship between the knee and the ankle is modified, particular during the swing phase of locomotion (i.e. after toe off but before the next heel strike).